
Digital marketing is always evolving, and it’s extremely important to ensure that you — regardless of whether you’re a marketer or business owner — are kept up to date with new developments. However, it can be difficult to find the time to read through article after article, and one way to get around it is through statistics.
Statistics provide information in a concise manner and can help you build and fine-tune your marketing strategies. We’ve gathered a range of data to help you know the latest trends, and how you can keep up with the rest. Being aware of digital marketing statistics can help you get the most out of your budget, as you consider digital marketing costs.
In this guide, we’re going to cover the following:
- Search Engine Optimization Statistics
- Content Marketing Statistics
- Social Media Statistics
- Video Marketing Statistics
- Email Marketing Statistics
- Lead Generation Statistics
- Advertising Statistics
- Marketing Technology Statistics
- Sales Statistics
Search Engine Optimization Statistics

Search Engine Optimization, also known as SEO, is the process of increasing the quality and quantity of website traffic by relying on organic search engine results. Organic search results are usually unpaid for and do not include direct traffic (i.e. users who visit the website directly) nor the purchase of ads in search engines.
As search engines generally rank the content they display based on several factors such as relevance, using effective SEO strategies is vital in increasing your website’s visibility, and hence traffic. The statistics below will not only give you insights into the current SEO trends but also help you refine your strategies.
Conversion Rate Optimization (CRO)
- The average conversion rate of a website across all industries is 2.35%. (WordStream, 2020)
- The top 25% of landing pages across all industries have average conversion rates of 5.31% or more. (WordStream, 2020)
- The top 10% of landing pages have average conversion rates of 11.45% or more. (WordStream, 2020)
- Across industries, arts and crafts have the highest average conversion rate (3.79%) while baby and child have the lowest (0.99%). (IRP Commerce, 2021)
- Referral traffic has the highest conversion rates (13.5%) followed by email (10.2%). (Growcode, 2021).
Ecommerce
- In 2020, total sales from retail e-commerce worldwide were $4.28 trillion and this is projected to reach $6.38 trillion by 2024. (Statista, 2021)
- There will be 2.14 bilion global digital buyers in 2021. Ecommerce platforms like Sellosity give the ability to launch stores in minutes. (Oberlo, 2021)
- There are more than 230 million online shoppers in the US today. (Statista, 2021)
- 53% of consumers have reported that free delivery is the #1 reason why they shop online. (Oberlo, 2021)
- The average e-commerce conversion rate is 1.94%. (IRP Commerce, 2021)
Local SEO
- 46% of all searches on Google are local searches. (Social Media Today, 2019)
- 97% of all search engine users look for local businesses via search. (Social Media Today, 2019)
- 61% of mobile users conducting a search are more likely to reach out to a local business if they have a mobile-friendly site. (Junto, 2019)
- “Store open near me” searches on mobile have increased more than 250% in the last couple of years. (Google, 2019)
Mobile Search
- 33% of shoppers use their mobile devices to look up prices being offered by competitors while shopping in-store. (PYMNTS, 2019)
- 78% of mobile searches based on location result in an offline purchase. (Junto, 2019)
- 86% of people use Google Maps to search for the location of a business. (Junto, 2019)
- Image searches on mobile have grown by over 60% in the last couple of years. (Google, 2019)
Organic Search
- Google is responsible for 92.1% of all search traffic globally. (Statista, 2021)
- As of January 2021, 93.22% of searches in the United States. (Statista, 2021)
- 88% of searchers click on results from the first page. (Sistrix, 2020)
- Organic searches constitute 53.3% of all website traffic across industries. (BrightEdge, 2019)
- Only 22.9% of companies hire for technical SEO or SEO analysis. (Backlinko, 2020)
- 50% of searches use four words or longer. (IMPACT, 2019)
- Organic search drives 2X more revenue for B2B companies than any other channel. (BrightEdge, 2019)
- The average CTR of the #1 organic Google search result is 31.7%. (Backlinko, 2019)
- Only 0.78% of searchers on Google click something that appears on page 2. (Backlinko, 2019)
- 94.3% of newly-published pages get zero traffic from Google. (Ahrefs, 2020)
Voice Search
- 65% of people between 25-49 years old speak to voice-enabled devices at least once every day. (PWC, 2019)
- 27% of the global online population use voice searches on mobile devices. (Google, 2019)
- 24% of Americans (60 million) people own smart speakers. (NPR, 2020)
- 41% of smart speaker owners use the voice-operated assistant on their smartphones every day. (NPR, 2020)
- 63% of Americans use voice-operated personal assistants on their devices. (NPR, 2020)
Content Marketing Statistics

Content marketing is a strategy that focuses on the creation of interesting and relevant content for your target audience. Instead of explicitly promoting your products or services, content marketing is all about sharing valuable information to build trust and loyalty, so you can convert them into paying customers.
These content marketing statistics will help you understand what other marketers are doing and techniques you can adopt or adapt to suit your brand and target audience.
Blogging
- Around 70 million new blog posts are created on WordPress every month. (WordPress, 2020)
- 36% of people prefer reading headlines that are list-based. (IMPACT, 2019)
- More than 409 million people read posts on WordPress each month. (WordPress, 2020)
- 66% of marketers used blog posts in their social media content. (Social Media Examiner, 2019)
- Among business blogs, listicles are the most popular blog post format. (Responsive Inbound Marketing, 2019)
Content Strategy
- 70% of marketers invest actively in a content marketing strategy. (HubSpot, 2020)
- 51% of B2B marketers see the creation of visual assets as a priority in their content marketing strategy. (HubSpot, 2019)
- Video content is the #1 type of media used in content marketing, followed by blogs and infographics. (HubSpot, 2020)
- 51% of companies evaluate their content marketing strategy as a good one while 11% evaluate it as excellent. (Semrush, 2021)
- 94% of B2B content marketers made changes to their content marketing strategy because of the COVID-19 pandemic. (CMI, 2020)
- 61% of marketers measure the ROI from content marketing. (Semrush, 2021)
Podcasts
- Mobile searches for “podcasts” have increased more than 80% in the past couple of years. (Google, 2019)
- 75% of Americans are familiar with the term “podcasting.” (Edison Research, 2020)
- Over one-third of the US population regularly listen to podcasts. (Edison Research, 2020)
- There are over 2 million podcasts out there today. (Podcast Insights, 2021)
- Apple Podcasts feature over a million podcasts in 175 countries and more than 100 languages. (Apple Newsroom, 2020)
Social Media Statistics

Social media platforms provide marketing opportunities for businesses to reach out to audiences of all demographics and have since become an essential tool in most marketing strategies. Social media statistics will help you learn about the benefits of using different platforms, so you can strategize and implement marketing strategies effectively.
- As of 2021, there are about 2.8 billion monthly active users (MAU) on Facebook. (Facebook, 2021)
- 1.3 billion fake accounts were removed in the fourth quarter of 2020. (U.S. News, 2021)
- In December 2020, Facebook recorded 1.84 billion daily active users on the platform. (Facebook, 2021)
- India has the largest number of Facebook users in the world at 320 million, followed by the US (190 million) and Indonesia (140 million). (Statista, 2021)
- Facebook recorded $27.2 in ad revenue in Q4, 2020, which accounted for 96.8% of its total revenue for the quarter. (Facebook, 2021)
- 54% and 46% of Facebook users are women and men, respectively. (Sprout Social, 2019).
- The highest traffic on Facebook occurs between 1 pm to 3 pm. (Zephoria, 2019)
- Engagement is 18% higher on Thursdays and Fridays. (Zephoria, 2019)
- Instagram has over 1 billion monthly active users as of 2020. (eMarketer, 2020)
- The US and India have the highest number of Instagram users in the world at 140 million each, followed by Brazil (99 million) and Indonesia (85 million). (Statista, 2021)
- 80% of Instagram users follow a business account. (Awario, 2019)
- Over 500 million active users use Instagram daily. (Oberlo, 2019)
- 70% of Instagram users are below the age of 35 (Statista, 2021).
- 500 million accounts use Instagram Stories on a daily basis. (Statista, 2021)
- 83% of Instagram users discover new products or services on Instagram, while 81% use it to research products or services, and 80% rely on the platform to decide whether to buy a product or service. (Facebook, 2019)
YouTube
- There are more than 2 billion monthly active users on YouTube. (YouTube, 2021)
- People watch more than a billion hours of video on YouTube every day. (YouTube, 2021)
- Localized versions of YouTube are available in 100+ countries and 80 languages. (YouTube, 2021)
- YouTube is the world’s second most popular site, second only to Google. (Alexa, 2021)
- In Q4, 2020, YouTube’s global ad revenue was 6.89 billion. (Statista, 2021)
- 70% of YouTube video watch time is from mobile devices. (Awario, 2019)
- As of 2020, Twitter has 314.9 million users worldwide. (Statista, 2021)
- The US has the largest number of Twitter users (69.3 million) followed by Japan (50.9 million) and India (17.5 million). (Statista, 2021)
- In Q4, 2020, Twitter recorded 192 million monetizable daily active users on the platform. (Statista, 2021)
- 77% of users feel better about a brand if their Tweet was replied to. (Brandwatch, 2019)
- 46% of users are active on Twitter daily. (Awario, 2019)
- 91% of marketing executives chose LinkedIn as the top place to find relevant and high-quality content. (Foundation, 2019).
- LinkedIn has a user base of over 722 million members across 200 countries. (LinkedIn, 2020)
- 663.3 million people have been reached using ads on LinkedIn. (We Are Social, 2020)
- LinkedIn has the biggest audience in the US with 170 million members followed by India with 71 million. (Statista, 2021)
- 60% of LinkedIn users belong to the age group of 25 – 34 years. (Statista, 2021)
- 94% of B2B marketers use LinkedIn as a channel to distribute content. (Foundation, 2019)
- 92% of B2B marketers use LinkedIn for their digital marketing. (Foundation, 2019)
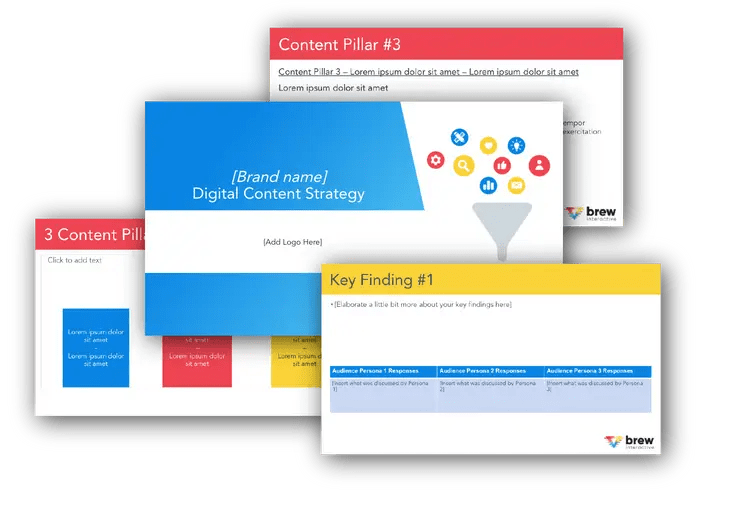
Free B2B Content Strategy Template
Not sure where to start when it comes to your content strategy? Struggling to gain traction? Grab our free B2B content strategy template to help you document your strategy.
- As of 2021, there are 459 million monthly active users on Pinterest. (Pinterest, 2021)
- 67% of Pinterest users are below the age of 40. (Brandwatch, 2019)
- 60% of all Pinterest users globally are women. (Pinterest, 2020)
- 90% of weekly users rely on Pinterest to make decisions about purchases. (Hootsuite, 2019)
- Pinterest users spend 29% more during their shopping than non-users. (Hootsuite, 2019)
Snapchat
- As of 2021, Snapchat has 280 million daily active users. (Snapchat, 2021)
- More than 5 billion snaps are created by users every day on the platform. (Snapchat, 2021)
- More than 200 million daily active Snapchat users engage with augmented reality on the platform. (Snapchat, 2021)
- Snapchat users below 25 years old visit Snapchat over 20 times and spend more than 30 minutes on the app daily. (Zephoria, 2019)
- 381.5 million people have been reached using ads on Snapchat. (We Are Social, 2020)
Social Media Usage
- There are more than 3.8 billion active social media users worldwide. (We Are Social, 2020)
- The most popular social media network is Facebook with over 2.7 million monthly active users. (Statista, 2020)
- On average, internet users between the ages of 16 and 64 years spend 2 hours and 24 minutes daily on social media. (We Are Social, 2020)
- In an internet minute, over 41 million messages are sent on WhatsApp and almost 350,000 Instagram Stories are posted. (Statista, 2020)
Social Media Marketing
- The most common publishing cadence on social media is 3-4 times per week. (HubSpot, 2020)
- Facebook is the most popular social media platform used by 94% of marketers worldwide, followed by Instagram (76%), LinkedIn (59%), and Twitter (53%). (Statista, 2021)
- 86% of marketers say that social media marketing has helped them increase exposure while 78% say that it has helped them increase traffic. (Statista, 2020)
- Identifying and reaching target audiences, calculating ROI, and achieving overall goals are the top three challenges faced by social media marketers today. (CMI, 2020)
Visual Content
- More than 70% of content used by marketers contains some form of visuals. (Social Media Today, 2020)
- Stock photos are the most popular form of visual content used by marketers and are used 40% of the time. (Social Media Today, 2020)
- 40% of marketers have reported that original graphics have helped them reach their marketing goals most effectively. (Social Media Today, 2020)
Video Marketing Statistics

Video marketing uses videos to engage a target audience and promote a product or service. Commonly seen on social media platforms, it has become a popular strategy for marketers due to its effectiveness in reaching out to consumers and ease of implementation. Video marketing statistics will help you understand the current trends, and how you can use them successfully.
86% of businesses use video as a marketing tool. (Wyzowl, 2021)
Product Video
- Product explainer videos are the most commonly created types of videos accounting for 73% of the total. (Wyzowl, 2021)
- 94% of video marketers feel that product videos have helped them enhance the understanding of their products among users. (Wyzowl, 2021)
- 96% of people have leveraged explainer videos to learn more about a particular product or service. (Wyzowl, 2021)
- 69% of people prefer watching videos to learn about a product over reading articles (18%), infographics (4%), or ebooks (3%). (Wyzowl, 2021)
Social Video
- Social media videos are the second most popular type of videos used in marketing. (Wyzowl, 2021)
- 89% of marketers plan to use YouTube videos as part of their marketing strategy in 2021. (Wyzowl, 2021)
- 70% of marketers plan to use Facebook videos as part of their marketing strategy in 2021. (Wyzowl, 2021)
- LinkedIn was the most successful channel for video marketing in 2019 with 87% of LinkedIn video marketers finding it effective. (Wyzowl, 2020)
- 63% of marketers plan to use LinkedIn videos as part of their marketing strategy in 2021. (Wyzowl, 2021)
Video Analytics
- On average, people watch 18 hours of video online every week and 2.5 hours every day. (Wyzowl, 2021)
- 63% of marketers use engagement, 58% use reach, 55% use leads and click-throughs, and 42% use brand awareness to measure ROI from video marketing. (Wyzowl, 2021)
- 86% of video marketers say that video has helped them increase traffic and 83% say that it helped them increase the average time spent on-page. (Wyzowl, 2021)
- People are 2X as likely to share videos with people they know than other forms of content. (Wyzowl, 2021)
Email Marketing Statistics

Email marketing is one of the most familiar marketing strategies and remains an essential tool for any marketer. Emails are sent to both prospects and customers, with the aim of converting the former, and retaining the latter. Email marketing statistics help you discover how emails can be effectively used to reach out to your target audience.
Conversions
- Users who read emails on mobile and open an email a second time from a computer are 65% more likely to click through. (Campaign Monitor, 2019)
- Across the e-commerce industry, welcome emails have the highest conversion rates (51.94%) followed by cart abandonment emails (33.89%). (Statista, 2020)
- Ecommerce product abandonment emails have the highest open rates (37.75%) followed by post-purchase emails (34.01%). (Statista, 2020)
- Email marketing has an average ROI of $42 for every $1 spent. (Litmus, 2019)
Email Copy
- 91% of consumers want to hear from companies they do business with via email. (Sleeknote, 2019)
- Email subject lines with 3-5 words perform the best in terms of open and reply rates. (Yesware, 2020)
- Emails with a single question in them have the highest reply rates. (Yesware, 2020)
Email Segmentation
- Marketers who use segmentation to run their email campaigns have reported a 760% increase in their revenue. (HubSpot, 2020)
- 74% of online users find it annoying when businesses send them emails that have nothing in common with their interests. (Campaign Monitor, 2019)
- Segmentation is the second biggest priority for email marketers after increasing subscriber engagement. (SuperOffice, 2021)
- Segmented campaigns have earned 38% click-through rates and 94% open rates as compared to 4.5% click-through rates and 42% open rates from non-segmented ones. (SuperOffice, 2021)
Email Usage
- The number of email accounts that are active is expected to reach 5.6 billion in 2019. (Statista, 2019)
- 87% of B2B marketers and 79% of B2C marketers use email to distribute content. (CMI, 2020)
- 4.037 billion people have used email in 2020 and this number is expected to reach 4.6 billion by 2025. (Statista, 2021)
- 21.5% of emails are opened within an hour of receiving them. (GetResponse, 2020)
- Apple iPhone and Gmail are the two most popular email clients accounting for 38% and 30% of all email opens respectively. (Litmus, 2021)
Lead Generation Statistics

Lead generation is the identification of prospects, with the idea of converting them into customers. Contact is then initiated with these leads to generate their interest. Lead generation statistics will help you gain insight into how this strategy can be used to convert your target audience into paying customers effectively.
Demand Generation
- 85% of marketers use email campaigns, 54% use paid advertising, and 49% use storytelling/evoking emotions as a demand generation technique to nurture audiences. (CMI, 2020)
- 75% of organizations use conversions, 74% use website traffic, 64% use engagement, and 56% use the quality of leads as metrics to measure the impact of content marketing on demand generation. (CMI, 2020)
- 76% of organizations view content marketing to be extremely or very important for demand generation. (CMI, 2020)
Marketing Analytics
- 75% of marketers report how their campaigns directly influence revenue. (HubSpot, 2020)
- 52% of marketers use attribution reporting. (HubSpot, 2020)
- 35% of marketers feel that analyzing the ROI from campaigns is extremely or very important. (HubSpot, 2020)
- The #1 SEO tool used by marketers is Google Analytics. (HubSpot, 2020)
Marketing Automation
- 51% of businesses currently use marketing automation. (Emailmonday, 2019)
- 58% of B2B companies are planning to adopt marketing automation. (Emailmonday, 2019)
- 48% of marketers who use automation consider it to be one of the top 4 methods of creating personalized experiences for customers. (House of Marketing, 2019)
- 68% of marketers report that their organization uses automation in some manner. (HubSpot, 2020)
- 23% of marketers who use marketing automation, use it to automate their content delivery. (HubSpot, 2020)
Advertising Statistics

Digital advertising is everywhere, and most businesses, regardless of their size or industry, will rely on this tool to attract customers. Usually paid for, great advertising will not only increase brand awareness but also help build a strong and loyal customer base. Advertising statistics help you learn the tactics that are commonly used today and how they can be used towards your target audience.
- As of January 2021 there were 4.66 billion active internet users worldwide – 59.5 percent of the global population. (Statista, 2021)
- 50% of marketers believe digital advertising to be more effective than traditional. (Lyfe Marketing, 2019)
Ad Blocking
- In 2019, 47% of internet users worldwide use an ad-blocker. (Digital Information World, 2019)
- The most popular app currently available for blocking ads is Adblock Plus. (VPN Mentor, 2019)
- 61% of ad-blocking users in the US say that they would never return to a website that disables their ad-blocker without their permission. (eyeo, 2019)
- Only 38% of ad-blocking users in the US would turn off their ad-blocker if a website asks them to. (eyeo, 2019)
- The top three motivations for ad-blocking are “too many ads,” “annoying or irrelevant ads,” and “intrusive ads.” (VPN Mentor, 2019)
Display Advertising
- Audience targeting and ad placement are the top two optimization tactics that marketers use to improve advertising performance. (HubSpot, 2020)
- Facebook ads are the second most valuable Facebook feature (after the Facebook business page) for hitting marketing goals. (HubSpot, 2020)
- 68% of marketers report that paid advertising is extremely or very important to their overall strategy. (HubSpot, 2020)
- Among all paid channels, Facebook provides the highest ROI. (HubSpot, 2020)
Retargeting
- Retargeting results in a 180% higher CTR compared to non-retargeted ads. (I-Com, 2020)
- The conversion rate from retargeted ads is 291% higher compared to non-retargeted ads. (I-Com, 2020)
- Retargeted users are 8x cheaper to reach. (I-Com, 2020)
Mobile Advertising
- Mobile devices accounted for 55% of global digital ad spend in 2020. (Statista, 2021)
- The US (61%) and China (65%) are the largest markets based on mobile ad spend. (Statista, 2020)
- In 2020, the share of global mobile advertising revenues was 55.1% which is expected to grow to 65.3% by 2025. (Statista, 2020)
Pay-Per-Click (PPC)
- 63% of people are likely to click on a Google ad. (Search Engine Land, 2019)
- 49% of people have been found to click on text ads. (Blue Corona, 2019)
- For every $1 spent on Google AdWords, businesses have been found to earn an average of $2. (Blue Corona, 2019)
- Digital marketing budgets average 45-50% of the overall marketing budget for most businesses. (Business2Community, 2020)
Video Advertising
- Video advertising is the third-fastest growing digital ad segment with an expected CAGR of 6.5% by 2025. (Statista, 2020)
- Video advertising was the digital ad segment that was least affected by COVID in 2020, with a global ad spend of $33.3 billion. (Statista, 2020)
- The US is the biggest video advertising market with total spending of $13.2 billion in 2020. (Statista, 2020)
Marketing Technology Statistics

Marketing technology is essentially a combination of marketing and technology by leveraging technology-based tools to perform marketing activities effectively and efficiently. Marketers often use a group of tools (known as a ‘stack’), which varies depending on the size of the business and the industry. Marketing technology statistics help you discover the best tools and how they can be used to manage your marketing strategies.
70% of of companies either have a digital transformation plan in place, or are working on one. (ZDNet, 2018)
Messaging Apps
- 2.77 billion people use mobile messaging apps. (Statista, 2021)
- With 2 billion monthly active users, WhatsApp was the most popular mobile messenger app worldwide in 2020. (Statista, 2021)
- As of Jan 2021, Facebook Messenger has 1.3 billion monthly active users. (Statista, 2021)
- 41.7 million messages are shared every minute on WhatsApp. (Statista, 2020)
Mobile
- There are 3.5 billion mobile phone users all over the world. (Statista, 2020)
- The time spent daily by users online is distributed evenly between mobile and PCs. (Statista, 2020)
- The global average monthly data traffic from mobile phones is estimated to reach 150 exabytes by 2025. (Statista, 2020)
- In 2019, the global monthly data traffic per smartphone was 7.2 gigabytes and this is estimated to reach 24 gigabytes by 2025. (Statista, 2020)
- 59% of consumers say that the ability to shop via mobile devices is an important factor in deciding whom to buy from. (Think with Google, 2019)
- 60% of mobile phone users have contacted a business from Google search results using the click-to-call feature. (Think with Google, 2019)
- A delay of one second in mobile page responses can reduce conversions by as much as 7%. (99 Firms, 2019)
Artificial Intelligence (AI)
- In 2019, 62% of consumers expressed their willingness to use AI to enhance their experiences, as compared to 59% in 2018. (Salesforce, 2019)
- It is estimated that 15% of global customer service interactions will be powered by AI by 2021. (Gartner, 2019).
- 23% of customer service organizations use chatbots powered by AI. (Salesforce, 2019)
Sales Statistics

Sales is a critical component in most businesses, and having effective marketing will go a long way in increasing sales, hence both elements are closely linked. Sales statistics help you identify ways to strengthen this relationship, to ensure that both work well together in boosting customer engagement and sales.
CRM
- The global CRM market has been valued at $40.2 billion in 2019 and expected to grow at a CAGR of 14.2%. (Grand View Research, 2020)
- 91% of businesses having more than 10 employees have adopted a CRM system in their organization. (Grand View Research, 2020)
- Sales leaders who adopted remote sales in 2020 ranked CRMs as the second most important tool for their team’s success. (HubSpot, 2020)
- Sales leaders ranked CRMs as the first or second most important sales tool regardless of their performance in 2020. (HubSpot, 2020)
- 61% of overperforming sales leaders use CRM to automate their sales processes as compared to 46% of underperforming sales leaders. (HubSpot, 2020)
Selling
- 64% of sales leaders who adopted remote sales in 2020 met or exceeded their revenue targets as compared to 50% of leaders who did not do so. (HubSpot, 2020)
- Successful sales representatives are 10 times more likely to use words that are collaborative, such as “us,” “we,” and “our.” (Zety, 2019)
- 20% of salespeople contribute to 80% of sales. (Zety, 2019)
- 65% of overperforming sales leaders have a dedicated sales enablement team or person. (HubSpot, 2020)
Social Selling
- Facebook and Instagram are the social media channels with the highest ROI. (HubSpot, 2020)
- More than 76% of buyers are ready to have a conversation with sellers on social media. (LinkedIn, 2020)
- More than 62% of B2B buyers are known to respond to salespeople who connect on social media with relevant opportunities. (LinkedIn, 2020)
- Social selling has been known to create 45% greater sales opportunities. (LinkedIn, 2020)
It is essential to be aware of the latest developments in the marketing industry, and prevent yourself from falling behind. Statistics help you get to the heart of what matters, so you can keep up without spending too much time.
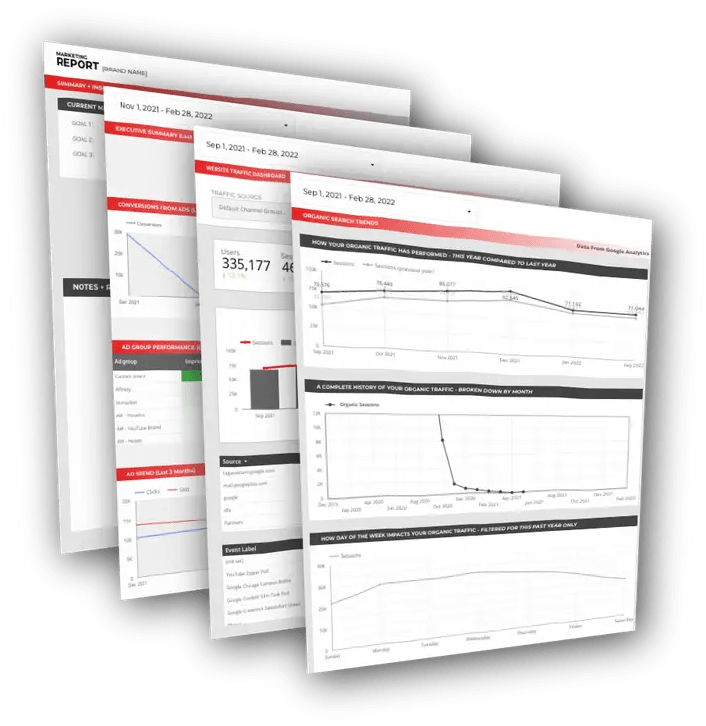
Free DataStudio Marketing Report
Improve your marketing reporting with our free DataStudio template that pulls data from Analytics, Google Ads, and Search Console to get a 360 degree view of your digital performance.
Marcus Ho is the founder and Managing Director of Brew Interactive, an award‑winning B2B digital‑marketing agency that helps organisations transform their sales and marketing processes in the Asia‑Pacific region. With a career spanning over a decade in digital, he has led strategies for global brands such as Hitachi, Bosch, and 3M, focusing on data‑driven campaigns and go‑to‑market acceleration.
