Everyone is investing in digital marketing. eMarketer predicts digital advertising spend will rise to $785 billion by 2025 – more than double what it was in 2020.
And that’s just digital advertising. It doesn’t include how much businesses are spending on SEO, email marketing, and social media management.
But is it working?

Sure, it’s definitely more effective and trackable than traditional tactics, but do you know just how much more? Do you know your ROI by marketing channel? Can you tell your team the ratio of your customer acquisition cost to customer lifetime value without having to sit down and do some math?
If the answer to these is yes, it’s because you’ve got your digital marketing reporting in check.
If the answer is no, you need to get your digital marketing reporting in check.
Lucky for you, in this post we’ll cover:
- The 4 most important digital marketing metrics to track
- How to set realistic KPIs for your key metrics
- Which metrics matter most for each stage of the buyer’s journey
- How to tailor marketing dashboards based on company role
- The best tools for digital marketing reporting and tracking
The 4 Most Important Digital Marketing Metrics to Track
There are thousands of digital marketing metrics you could be tracking.
But many of them are just vanity metrics. They don’t actually tell you how your marketing is performing and how it’s impacting your business, nor do they help you take action moving forward.
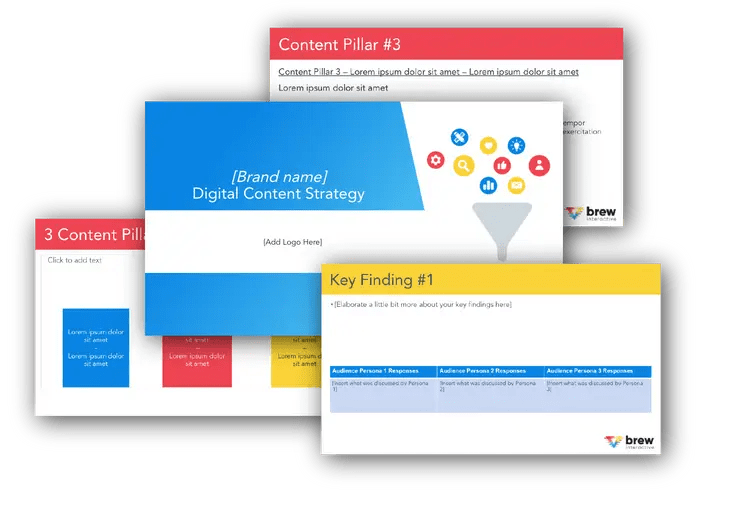
Free B2B Content Strategy Template
Not sure where to start when it comes to your content strategy? Struggling to gain traction? Grab our free B2B content strategy template to help you document your strategy.

For example, site traffic is great. But plenty of sites get lots of traffic while their revenue plummets.
Bounce rate is another. What good is a low bounce rate if people are just bouncing around aimlessly and not converting?
Even conversion metrics don’t always tell the full story.
So what digital marketing metrics should you track if you really want to get the full picture of your marketing performance? Here are the four we recommend:
1. Customer Acquisition Cost (CAC)
Customer Acquisition Cost (CAC) tells you the average cost your company spends to acquire a new customer.
CAC illustrates how much your company is spending per new customer acquired. The lower the CAC, the more profit you can make from each client. In an ideal world, you want to recover the cost of acquiring a customer within the first 12 months.
You will want to monitor this month over month. An increase in CAC means you’re spending more on acquiring customers – and unless your customer lifetime value has also increased, you may be losing money.
Calculating CAC:
Take your total sales and marketing spend for a specific time period and divide by the number of new customers for that time period.
Sales and Marketing Cost = Program and advertising spend + salaries + commissions and bonuses + overhead in a month, quarter, or year
New Customers = Number of new customers in a month, quarter, or year

Let’s look at an example:
Say your company sells a SaaS product that bills clients $300 per month. Our sales and marketing expenses and customers acquired from those efforts are as follows:
Sales and Marketing Cost in a month = $27,000
New Customers in a month = 9
CAC = $27,000 / 9 = $3,000 per customer
At a CAC of $3,000 per customer, your company is in a good place to be profitable after month 10.
Not only can you calculate your total CAC across the company, but you can get granular into each channel. You should always be asking which channels have the lowest CAC.
KPI Goals for CAC
When you’re thinking about goals, objectives, and KPI’s for Customer Acquisition Cost, you need to look at it in conjunction with Customer Lifetime Value (which we’ll do next). CAC on its own isn’t all that helpful.
For example, you may hear your CAC is $10,000 and start to worry because it’s such a big number. But if the average lifetime value of a customer is $20,000 – you’re running a very profitable company.
A good rule of thumb is whether or not you can make your money back in under 10 months.
2. Customer Lifetime Value (CLV)
Customer lifetime value (CLV) is a measurement of how valuable a customer is to your company, not just on a purchase-by-purchase basis but across the whole relationship. CLV is the total value of a customer to your business.
If a customer were to buy a single $10 product from your business and never buy anything again, their CLV would be $10.
If a customer were to be a longtime customer paying $100 per month for 10 years, their CLV is $12,000.
Calculating CLV:
There’s no fancy formula for CLV, just add up all the payments a customer has made to you. Then, take the sum of all your customers’ CLV within a given time period and divide by your total number of customers.

KPI’s for CLV
As with CAC, there’s no universal benchmark for CLV – it depends largely on your CAC and other factors. Keep track of it, but evaluate it in conjunction with these other metrics.
3. Ratio of Customer Lifetime Value to CAC (CLTV:CAC)
The Ratio of Customer Lifetime Value to CAC is a way for companies to estimate the total value your company gains from each customer compared to what you spend to acquire that customer.
The higher the CLTV:CAC, the more ROI your sales and marketing team is delivering to your bottom line.
However, if this metric is too high, it may indicate you’re missing out on an opportunity to scale. Spending more on sales and marketing will reduce your CLTV:CAC ratio, but could help speed up your total company growth.
The ideal is to be something close to a 3:1 ratio, if 1:1 or under you are spending too much to get a client as you are losing money on the deal, and if it is 5:1 or over you may be missing out on potential customers and an opportunity to grow.
That said, a high ratio is a much better “problem” to have compared to losing money on each customer 🙂
How to Calculate Customer Lifetime Value to CAC
To calculate the CLTV:CAC you’ll need to compute the Lifetime Value, the CAC and find the ratio of the two:

KPI’s for CLTV:CAC
As mentioned, a good goal in general is to be positive (greater than a 1:1 ratio), but most would say the ideal ratio would be 3:1 A negative ratio would indicate you’re spending more on marketing than you’re bringing in, and anything above 5:1 might indicate you’re missing an opportunity to scale the business.
4. Marketing Originated Customer %
Marketing Originated Customer % is a ratio that tells you what new business is driven by marketing.
This metric illustrates the impact that your marketing team’s lead generation efforts have on acquiring new customers compared to your other efforts.
This percentage is based on your sales and marketing relationship and structure, so your ideal ratio will vary depending on your business model. A company with an outside sales team and inside sales support may be looking at 20-40% Margin Originated Customer %, whereas a company with an inside sales team and lead focused marketing team might be at 40-80%. A company without a sales team would have a 100% marketing originated customer %.
Tracking this metric will require a lot of communication between your sales and marketing teams to make sure everyone knows what leads come from which sources and how they are being tracked. Ideally, this would be done using a CRM / marketing automation software. If you aren’t using one, you’ll have to diligently track your leads.
How to Calculate Marketing Originated Customer %
To calculate Marketing Originated Customer %, take all of the new customers from a period, and tease out what percentage of them started with a lead generated by your marketing team.

Marketing Originated Customer % KPI’s
Your KPI here should depend on your sales and marketing structure. A company that puts equal investment into both teams should shoot for around 50%. A company with a small or only inside sales team should shoot for around 75%.
Metrics and KPIs for Each Stage of the Customer Journey
The four metrics covered above are all about the big picture. If you want to tell someone how your marketing is doing in less than 30 seconds, or if you want to know where to focus your efforts next quarter, you should look at the above metrics.
But what if you’re looking to improve those big picture metrics? These are what we might call “lag measures.” Once you know the value, it’s too late to do anything about it.

So if you want to influence them, you need to put your focus on “lead measures.” And one of the best ways to do this is by:
- Identifying the big picture area you need to improve
- Focusing in on the most relevant customer lifecycle stage
- Setting goals and KPIs for that stage
So let’s look at the six most common stages of the buyer’s journey and look at the most crucial metrics and KPIs for each:

Stage 1: Subscribers
The first stage of the typical customer lifecycle journey involves subscribers – those who are interested in more information about your business or product, but not considering working with you yet.
Some of the most common ways someone becomes a subscriber is by signing up for an email list, downloading a piece of content, attending a webinar, or stopping by your booth at an event.
Subscriber KPIs
Consider tracking these two KPIs:
1. Visitors to Subscribers Conversion Rate
This metric shows the percentage of people visiting your site who turn into subscribers.

For example, if your website had 20,000 visitors and 1,000 subscriptions last month, your conversion rate is 5%.
Formula: Total Visitors / New Subscribers
KPI Benchmark: 5% is a good goal to shoot for, but it will ultimately depend on how many opportunities you have on your site to convert.
2. Average Monthly Sessions
Monthly sessions tells you how many times your site was accessed each month. It’s important to track this KPI because the more your website is viewed.
Monthly sessions doesn’t tell you everything, but the more traffic you have, the better chance you have at gaining subscribers and leads – if you’re appealing to and attracting the right audience.

KPI Benchmark: There’s not a set number to shoot for, but ideally you will want this number to grow gradually over time. A good KPI would be to grow at around 8-10% monthly over time.
Stage 2: Leads
During the second stage, your subscribers become your leads who are contacts that have shown willingness to buy your product/service.
Many companies define a lead as a contact that expresses interest by sharing contact information, such as an email ID, a phone number, or even a social media handle.
However, unlike a subscriber, your lead shows more interest in whatever you are selling by signing up for a content offer from your business.
Lead KPIs
There are two KPIs you’ll want to track in this phase:
1. Subscriber to Lead Conversion Rate
It helps you track how many of your website subscribers turn into leads. It’s important to track this KPI if you want to know how effective your lead nurturing efforts are.

Suppose out of your 1,000 subscribers 100 turned into leads, then this rate would be 10%.
You’ll need to be able to track your subscribers accurately in order to report on this accurately. The best way to do this is by using a marketing automation or CRM software.
KPI Benchmark: A good goal to start with might be around 3-5%. But as with other KPIs, the goal should be to improve your conversion rate over time.
2. Number of New Prospects Broken Down by Acquisition Channel
It helps you know how many people become your leads from sources other than your site, such as your social media or Google ads.
The best way to track new prospects by acquisition channel is in Analytics or a marketing automation software.
Within Analytics, you’ll want to look at specific goal completions broken down by channel. Marketing automation platforms like HubSpot will have a dashboard for this.

KPI Benchmark: A good goal to start with might be around 3-5%. But as with other KPIs, the goal should be to improve your conversion rate over time.
Stage 3: Marketing Qualified Lead (MQL)
The third stage specifies your contacts who have engaged with your marketing efforts but are still not ready to receive a sales call. For example, a lead responding to a specific form in your marketing campaign.
MQL actions may include: filling out online forms, frequent visits to your website, signing up for a webinar or a trial, adding items to their carts, attending software demos, and so on.
MQL KPIs:
During this stage, consider tracking:
1. Click-through rate (CTR) on emails and downloadable content
It shows how many people clicked on the emails or other digital content developed by your marketing team. It’s important to calculate this KPI because it shows how much engagement your marketing materials get. A high CTR indicates that your marketing efforts are effective.

Suppose you sent a marketing email to 1,000 contacts but only 400 of them clicked on the link within your email, then your CTR will be 40%.

KPI Benchmark: Average email CTRs are around 2-3%. This is a good place to start, but a good goal to shoot for might be 5%.
6. Cost per MQL lead
This KPI shows how much cost you incurred in acquiring one MQL Lead. It helps you gauge the effectiveness of your marketing efforts in terms of costs.

KPI Benchmark: This all depends on your MQL to close rate, CAC, and your CLV. Your cost per MQL should be your lead-to-close rate multiplied by your desired CAC.
So if you want to spend $100 or less per customer, and you close 30% of your MQLs, then your cost per MQL lead should be no more than $30. Otherwise you may be cutting into your CAC and spending too much to acquire leads.
Stage 4: Sales Qualified Lead (SQL)
Your SQLs are the contacts that have indicated through their actions that they are ready for a direct sales follow up. For example, a lead submitting a question about your product via a contact form.
SQL KPIs:
At this stage, consider tracking:
1. MQL to SQL conversion rate
It shows the percentage of MQLs that get converted to SQLs. A higher value of this rate shows that more of your leads are now interested in the purchase and can be followed by your sales team.

KPI Benchmark: There’s no magic number, but the average is around 13%. A good goal to shoot for might be around 20%, but this largely depends on your industry.
2. Lead score
Each lead that comes in should have their own numerical score indicating their position in the buyer’s journey. The higher the score, the closer they are to purchasing.
When a lead performs a certain action (such as clicking through on a marketing email, signing up for a webinar, or requesting a demo) add a certain amount of points to their score. And once they reach a certain score (indicating a high level of interest in your business) they then become an SQL and are passed over to the sales team.

Stage 5: Opportunity
At the fifth stage, your SQLs turn into contacts with real sales opportunities. For example, contacts having a discovery meeting and requesting a proposal.
Opportunity KPI’s
At this stage, you should track:
1. SQL to Opportunity conversion rate
It measures the percentage of SQLs that turn into real sales opportunities. It’s important to track this KPI because it indicates how many of your leads are now ready for purchase.

KPI Benchmark: Top companies report nearly 60% conversion rates from SQL to Opportunity. This is a lofty goal, but worth shooting for. If you’re struggling here, it’s a reflection on your sales team, the quality of your product, or the price of your product.
Stage 6: Customer
The last stage is when a lead turns into a contact with a closed deal and becomes a paying customer.
Customer KPIs
In this phase, consider tracking:
1. Cost per acquisition (CPA)
It measures the aggregate cost to acquire one paying customer, and helps you determine the cost-effectiveness of your campaign.

For example, suppose you run a paid ad campaign for your business with a total budget of $500. After the campaign ended, you calculate that it resulted in 25 sales. So your CPA would be $20.
KPI Benchmark: Your CPA depends almost entirely on your CLV discussed above. You should aim for about one third of your CLV. So if your CLV is $100, your CPA should be $33 or less.
Tips for Digital Marketing Reporting
Now that you know which metrics and KPIs to focus on, how should you handle reporting to your shareholders, higher ups, and the rest of your team?
Here are a few tips to help you report on your marketing efforts and progress effectively.
Focus on Your Goals
The key to any reporting is to make sure you can tie the metric to the KPI it directly impacts. Don’t cloud your reports with numbers that don’t help get the right points across.
Your boss and higher-ups may care about vanity-type metrics, but it’s your job to shift the focus to the metrics that matter the most.
Tell a Story
Metrics are helpful, but they need context around them. As you put together a marketing report, make annotations and highlight key things. Add names and faces to your conversion data to really make it more personal.
For example, if you had 10 sales last week, pull out 2 or 3 of the most interesting marketing journeys and tell their story.
This will help add much needed human contexts to your reports.
Focus on Format and Design
How does your boss like to read reports? As a text summary, as a dashboard with top-level numbers, as a report with graphs?

Reports should include any wins and supporting information in a visual way. Unless you know your boss prefers a written brief, using a tool to visualize your data will help you better convey the success of your win.
Tailor Marketing Dashboards by Company Role
Set up reports based on audience type and customize each dashboard to cater to the visual needs of each.
Audience 1: Owners and the C Suite
When reporting to your C suite, the business owner, and any investors – your report needs to be succinct. Configure a reporting dashboard with key metrics that are tied directly to your ROI and primary KPIs so they can, at a glance, get an understanding of their marketing team’s efforts.
Make sure the reports have enough information to tell the whole story and for your C suite to ask follow-up questions if they want to.
This dashboard should be more than just conversions from an ad campaign. You’ll want to dig deep here and pull out numbers like customer acquisition cost (CAC) and ratio of customer lifetime value to CAC.

Example of marketing dashboard for C Suite of a SaaS company
Audience 2: Your Marketing Team
This report should have slightly more in-the-weeds metrics like details about traffic, conversions by channel and campaign, impressions, clicks, keywords, and all the other good stuff you need to make strategic changes to your account.
If you’ve got a large marketing team siloed into PPC, SEO, social, email, etc. you’ll want to include a page of this report that shows full-funnel, cross-functional impact. This means having a part of your report that shows your entire client’s journey, from first contact to last.

Marketing dashboard example for a marketing team
Various reporting software tools will report either first or last attribution. Meaning all the credit for the sales goes to the first time they made contact with your content (first attribution) or the very last thing they did before purchasing (last attribution). But as we know, not all the credit should be given to one point of contact.
Audience 3: Everyone Else
Depending on your company size, you might have more groups to report to. Maybe you have a PR team, or regional departments, or a sales team you need to report to.
You’ll want to meet with these departments and find out which KPIs they are responsible for and how your marketing efforts help them achieve those goals. Use those metrics as the basis of your report.
How Often to Report on Digital Marketing
How often you need to report on marketing will depend on which audiences you are reporting to.
Here’s a helpful guideline:
- Report on marketing to your c-suite every month (they may want to see things more often, but it’s probably not necessary)
- Report to your marketing department every week
- Report to the rest of your company as you see fit (quarterly is probably fine)
Regardless of how often you report your metrics, if you have a big marketing win, report that ASAP! When a big win comes out of your marketing department, shout it from the rooftops because you’ve earned it.
Reporting can be daunting, especially if you’ve had a rough month. But transparency is key. If you can go into that review meeting owning up to the bad numbers and having a plan to get back on track, your boss will appreciate that over vanity metrics that you can’t explain or tie back to your overall business goals.
Best Tools for Marketing Reporting and Dashboards
Now that you know how to report effectively on digital marketing, here are some helpful reporting tools.
We’ve divided them into two categories: Aggregators and Channel-Specific. Data aggregators are tools that help you create dashboards by pulling data from multiple sources.
Channel-Specific tools are the tools you’ll need to actually gather data from different sources.

Google Search Console
Channel-Specific Reporting Tools
- Google Analytics: Google Analytics is the best tool for tracking website traffic, acquisition, goal completions, and more.
- Search Console: Google Search Console is the best free tool for tracking SEO performance. If you can afford to pay for a premium tool, we’d recommend Ahrefs or SEMRush.
- Lead / Sales Reporting: For any data related to your sales funnel, you need a CRM. The two leading CRMs are HubSpot Sales and Salesforce. If you want to track users and their activity, you’ll need a marketing automation software like HubSpot or Pardot.
- Ads Data: To track ads data, you’ll almost always use the native platform (Google, Facebook, TikTok, etc…)
Big Picture Dashboards

Example of a DataStudio Report
- DataStudio: DataStudio is a free tool from Google that allows you to pull data from different sources and customize the report.
- Databox: Databox is a premium dashboard platform that pulls data from different sources and offers a lot of helpful dashboard templates for reporting.
- Dashthis: Dashthis is very similar to Databox, helping you pull information from different sources and design your reports in a helpful way.
Report Confidently on Your Marketing Efforts
Knowing the right metrics to track, when to send reports, and what tools to use is only half the battle. Great digital marketing reporting comes down to knowing your company’s goals and making sure you’re telling the right story on how they’re going.

Don’t make guesses at how things are going. Track the right metrics, format your reporting effectively, and be confident.
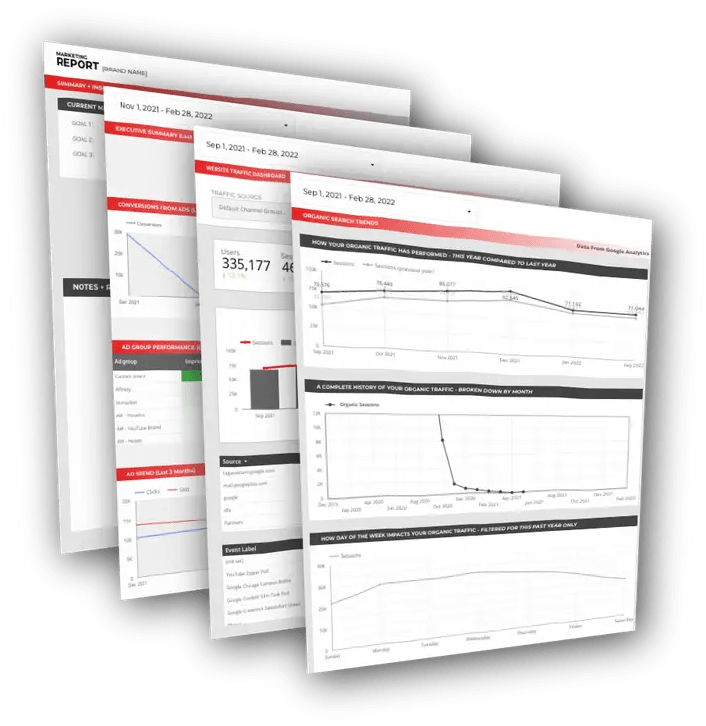
Free DataStudio Marketing Report
Improve your marketing reporting with our free DataStudio template that pulls data from Analytics, Google Ads, and Search Console to get a 360 degree view of your digital performance.